Pre-Lab
Independent: The different salt solutions added to the radish plant seeds.
Dependent: The amount of seeds that germinated and root size.
Control: Beaker 1 with no salt.
Experimental: The beakers with the salt solutions added.
Controlled: Same amount of seeds in each beaker, size of Petri dishes, total volume of liquid.
Dependent: The amount of seeds that germinated and root size.
Control: Beaker 1 with no salt.
Experimental: The beakers with the salt solutions added.
Controlled: Same amount of seeds in each beaker, size of Petri dishes, total volume of liquid.
Problem
What amount of concentration of salt in water allows for most vegitation growth in radish seeds?
Hypothesis
If different salt solutions are added to radish plant seeds, than Beaker 2 with 6.25% of salt will be the LD-50 for the seeds because salt is harmful to a plants growth; therefore, only 50% of the seeds will germinate.
Materials
Petri Dish x 6
Radish Seeds x 60
Paper towels
Water
Marker
Pencil
Calculator
Salt Solution
Beakers
graduated cylinder
Lab packet
Ruler
Radish Seeds x 60
Paper towels
Water
Marker
Pencil
Calculator
Salt Solution
Beakers
graduated cylinder
Lab packet
Ruler
Procedure
1. Fill one beaker with water and the other with a concentrated salt solution
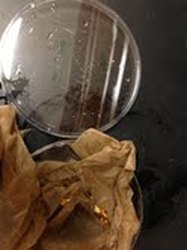
2. Put paper towels into each of the petri dishes with 10 raddish seeds wrapped inside of those paper towels
3. Use the graduated cylinder to prepare the different concentrations of salt solutions by measuring out the required amount of water and adding the respective amount of salt solution (as indicated in your lab packet) to create the appropriate solution that will be added to the radish seeds. 4.
4. Label the Petri dishes with as washable marker with the group number, dish number, and the percent concentration so you are able to know which petri dishes contain which types of concentrations
5. After measuring the correct solutions, moisten the napkins by pouring the appropriate solution over them according to it's label
6. Wait a few days
7. Take out the seeds and measure the length of the roots of each seeds
8. Record your findings
9. Calculate the average lengths that the different solutions produced
Analysis
1. What appears to be the LD50 for salt for radish seeds? Support your answer with data.
The LD 50 appears to be the 50% concentration of salt solution. 5 groups out of the total of 8 groups got 50% salt concentration to be their LD-50. The data shows that the average root lengths for each of the groups were: 26.8mm, .55mm, 0mm, .675mm, 4mm, 8.5mm, 31.8mm, and 1mm. This makes the total average root length for the seeds with a 50% salt concentration 9.16563mm with the major outliers being 31.8, 26.8, .55, and 0. This concentration also happens to be located right in the middle of the data, which makes sense why it is more likely to be the LD50; however, the data does not show a clear trend. As you can see from even simply looking at the different measurements of roots that each group recorded, you can tell that many groups got some extremely varying answers.
2. Is your radicle data supported by your germination data? Support your answer with data.
The data shows no correlation between the number of seeds that germinated and the LD-50. 6 out of the 8 groups had the greatest amount of seeds germinate for the experimental group that contained the least amount of salt solution (6.25%). Typically, in most groups, the 12.5% concentration wasn't too far from the amount that germinated in the 6.25% salt concentration batch; however, usually, the data dropped drastically between 12.5% concentration and our LD-50 group, which had 50% concentration of salt solution. One thing that I found interesting was that the control group typically had less germination than the group with 6.25% salt concentration; therefore, my hypothesis has been proven to be incorrect according to the data recorded in this experiment.
Conclusion
Looking back at the data, the hypothesis was not correct. It was initially predicted that the salt concentration that showed the most successful radish seed growth would be zero salt concentration because I thought that the salt would be an agent that would hinder the ability for the seeds to grow. The data showed that the greatest amount of root growth was 12.5%; however, although that was true according to the majority, that was only true for 3 groups. 2 groups had the greatest amount of root growth in 6.25% and 2 other groups had the greatest amount of root growth in 0%. The last group had the greatest amount of root growth in 50%, which is also the LD-50 for this lab. The most seeds germinated were found in the 6.25% salt solution. My hypothesis was proved wrong in this experiment because I guessed that a salt concentration of 6.25% would be the LD-50, which would mean that 50% of the seeds would die or not germinate; however, the group that showed the greatest amount of root growth was the 6.25% group.
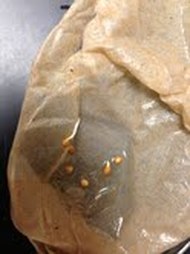
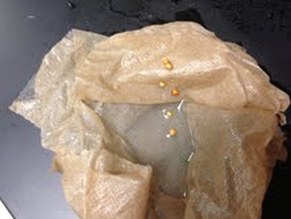
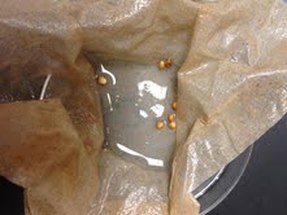
One of the greatest sources of error was the seeds as they were put in the Petri dish. Most of the seeds were put directly in between the two paper towels like the experiment called for; however, a couple seeds got loose and were not inside the paper towel. This appeared to be the reason why some of the seeds in concentrations in which had high root growth did not germinate and alter the lab data. If the seeds were more carefully put between the two paper towels, the experiment would have been more accurate. Also, many groups put too much water into their petri dishes and, therefore, drowned many of their seeds and hindered their growth. This could have changed the outcome of the experiment greatly. Another possible source of error is that the class data includes many outliers from all groups. Many other groups in the class had data that did not support the general trend of the majority. Because the data was an average, these outliers were included and made the data slightly deceiving. If we could simply eliminate the outliers, the experiment would be much more accurate.
One of the greatest sources of error was the seeds as they were put in the Petri dish. Most of the seeds were put directly in between the two paper towels like the experiment called for; however, a couple seeds got loose and were not inside the paper towel. This appeared to be the reason why some of the seeds in concentrations in which had high root growth did not germinate and alter the lab data. If the seeds were more carefully put between the two paper towels, the experiment would have been more accurate. Also, many groups put too much water into their petri dishes and, therefore, drowned many of their seeds and hindered their growth. This could have changed the outcome of the experiment greatly. Another possible source of error is that the class data includes many outliers from all groups. Many other groups in the class had data that did not support the general trend of the majority. Because the data was an average, these outliers were included and made the data slightly deceiving. If we could simply eliminate the outliers, the experiment would be much more accurate.
Real Life Example
This experiment not only revealed how salt effects the growth of radish seeds, but the overall concept having thresholds. This concept can be clearly exhibited in fertilizers. Fertilizers enable plants to grow more productively by supplying it with nutrients and substances such as phosphates and nitrogen. The process of making fertilizer, however, can be very difficult as it is crucial to find the key amount of these nutrients for the plant to yield maximum growth. Another concept that is exhibited with this lab is toxins. Mercury is a toxin that is consumed by humans every day through the environment or contaminated foods such as fish. Mercury can be very toxic, or even fatal in high doses; however, at very low concentrations, it can be virtually harmless.
"Easy Seed Germination." Seed Germination Tips and Techniques. N.p., n.d. Web. 23 Mar. 2013.
http://www.megagro.com/seed-germination.htm.
"Human Exposure." EPA. Environmental Protection Agency, n.d. Web. 23 Mar. 2013.
http://www.epa.gov/hg/exposure.htm.
"Easy Seed Germination." Seed Germination Tips and Techniques. N.p., n.d. Web. 23 Mar. 2013.
http://www.megagro.com/seed-germination.htm.
"Human Exposure." EPA. Environmental Protection Agency, n.d. Web. 23 Mar. 2013.
http://www.epa.gov/hg/exposure.htm.
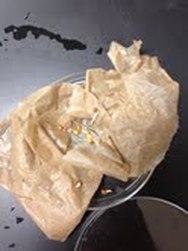
Dish 1 - 0% Salt Concentration
Dish 2 - 6.25% Salt Concentration
Dish 3 - 12.5% Salt Concentration
Dish 4 - 25% Salt Concentration
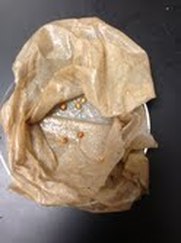
Dish 5 - 50% Salt Concentration
Dish 6 - 100% Salt Concentration
(Here you can also see how much water our seeds were drowning in and how this error in the experiment could have damaged our results)
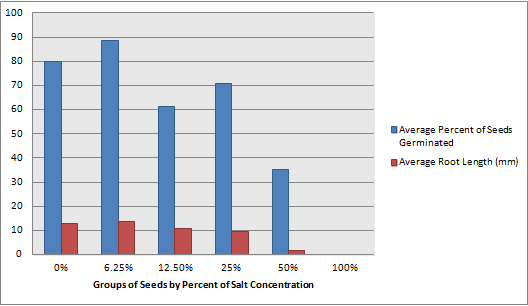
Although my hypothesis was wrong when it came to the LD-50 of the lab, by looking at this graph of the average percent of seeds germinated and the average root length in millimeters for each group, we can conclude that I was correct in my hypothesis when I said that concentrations of salt could hinder plant growth. My mistake came when I thought that a much smaller concentration, like 6.25%, would hinder the growth. When looking at the graph, we can see that the salt does not begin to have a noticeable effect until the solution is 50% salt and the salt doesn't completely halt growth and germination until the solution is 100% salt concentration.
